Visualizing Bitcoin Transactions in 3D and Virtual Reality
Abstract
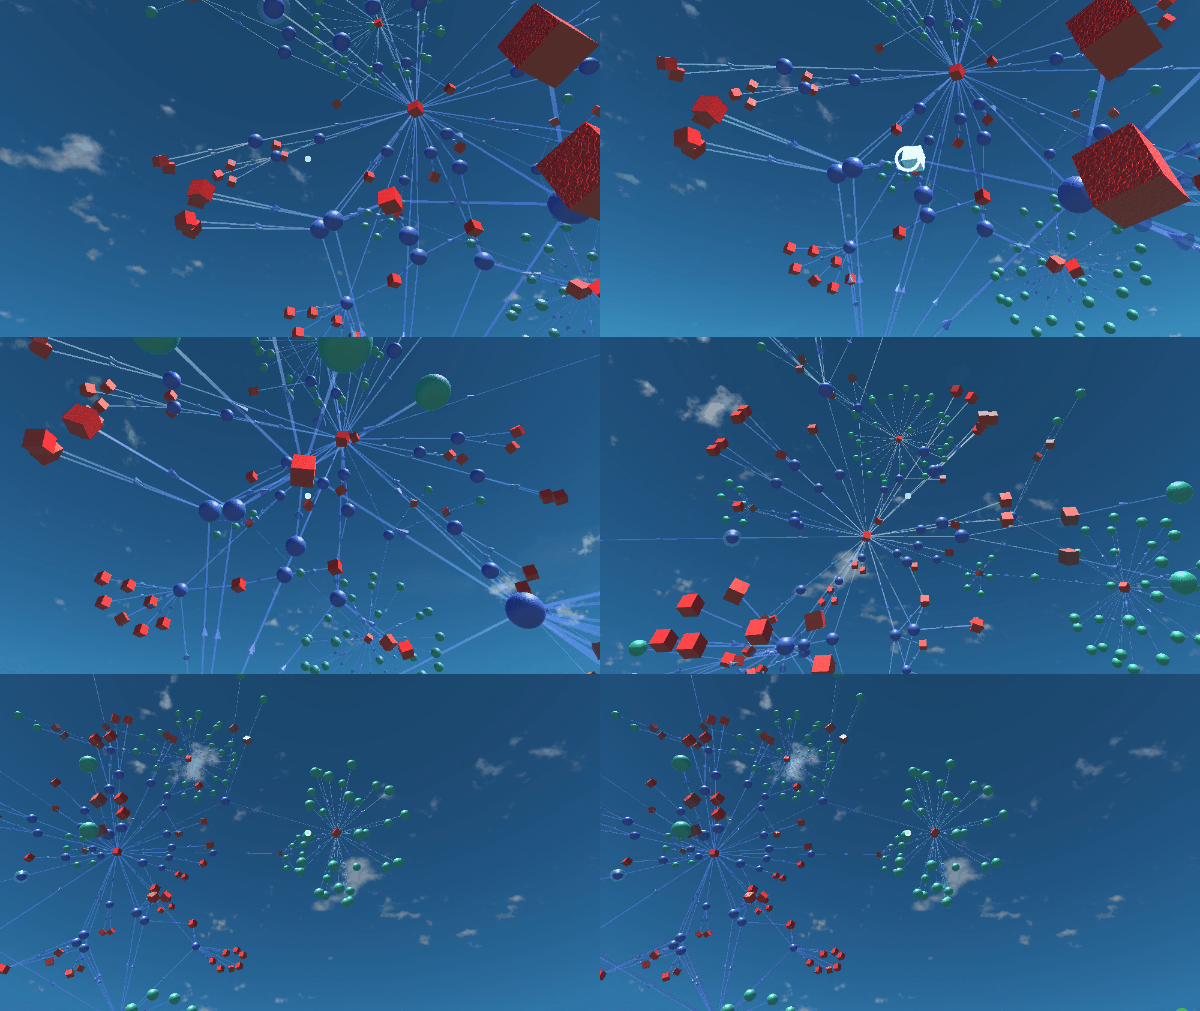
Bitcoin transactions form a graph that can be visualized in 3D and Virtual Reality (VR). This article explores how you can see these visualizations. The image below shows some of the network of transactions linked to the bitcoin pizza transaction . The red cubes are bitcoin addresses, blue spheres are bitcoin transactions and the arrows linking them are the movement of value:
Academic research¹ suggests that viewing information in VR helps people to spot patterns. There is an open-source, multi-platform project called blockchain3d.info that aims to develop these visualizations further.
Introduction
Blockchain technologies have grown in popularity very quickly. Having educational and analytical tools to help people make sense of blockchains will help the technologies grow further by removing barriers due to a lack of understanding. Over the last few years, VR has also grown in popularity. At the end of 2017 Facebook set the admirable goal of getting one billion people into VR . VR and its siblings (including augmented, mixed and diminished reality) offer a lot of promise. Academic research suggests that immersive Virtual Reality (VR) can “maximize intrinsic human pattern recognition and discovery skills” ¹. That’s a useful feature! The blockchain3d.info project aims to meet the need for blockchain education by using the benefits of VR. The project provides a free, open-source, multi-platform application for blockchain education and analysis using VR and 3D data visualizations. VR education and collaboration scenarios are the primary goals, however full 3D for desktops, tablets, and web browsers is also available. This allows additional use cases of more conventional analytics, forensics, producing 3D “fly-through” videos and other use cases not yet thought of. Exchanges or wallets may wish to differentiate themselves by offering 3D or VR views of transactions or wallets.
Bitcoin Transactions as a Graph
There follows a very simple example of an educational use case for bitcoin. It should be emphasized that this just scratches the surface of what can be done even with the current release of the application. Nevertheless, it is a reasonable and tangible first example. When dealing with fiat currency we are used to having bank transactions with a single sender and a single receiver. With bitcoin, transactions can move value from many senders to many receivers in a single transaction. In addition, bitcoin held in wallets is not held as a single “pile” but as a list of multiple “leftovers” (think “unspent change”) from previous transactions. These leftovers are the so-called Unspent Transaction Outputs UTXO . Imagine then explaining to a student how bitcoin value flows as inputs and outputs. In the image below, red cubes are addresses, blue spheres are transactions and the blue arrows show the flow of value for a single transaction:
With the above in mind, we can examine a transaction like the one shown below. This transaction (the blue sphere) has just one input yet has many, many outputs. These form distinctive “flower” shapes:
The Bitcoin Pizza Transaction
Early in 2018, the Google Cloud Platform team made bitcoin data available to their BigQuery web service. Their article on the subject outlines how some interesting 2D visualizations are possible. They focused on the famous bitcoin pizza transaction :
We can explore that same pizza transaction further by looking at it in 3D:
The application is interactive. We can “drill down” by clicking on addresses or transactions to display their linked addresses and transactions. We can also fly around the 3D space:

Using Google Cardboard , the same view can be experienced in VR. A longer example of how to use the application with commentary is here:
Lemme Try It!
The application is available for Windows, Mac, Linux, iOS and Android. Google Cardboard is supported for iOS and Android. To download the latest version, search for “Blockchain 3D Explorer” in your favored app store or visit the official site: https://blockchain3d.info.
Lemme Help!
The application and all the assets are open-source and available for you to download. In addition, contributions are very welcome! To fork your own copy or to help out, visit the project GitHub repository . …
Footnotes:
[1] See “Immersive and Collaborative Data Visualization Using Virtual Reality Platforms” https://arxiv.org/ftp/arxiv/papers/1410/1410.7670.pdf
- Kauri original title: Visualizing Bitcoin Transactions in 3D and Virtual Reality
- Kauri original link: https://kauri.io/visualizing-bitcoin-transactions-in-3d-and-virtual/ef32ddae59094e8b99c92131b9148200/a
- Kauri original author: Kevin Small (@kevnsmall)
- Kauri original Publication date: 2019-04-02
- Kauri original tags: 3d, visualization, data, virtual-reality, vr, bitcoin
- Kauri original hash: QmYT13BAknz932omnmKhKoSfyY8ffKuJiAQGnt3wEGBiKG
- Kauri original checkpoint: QmRS3wCLX2MRi62bg9NTM89qNkgm3XjpKXciLvCKAr1f1g